
I. The source lists are getting shorter
Since May, some AI models have been showing noticeably fewer sources with their answers.
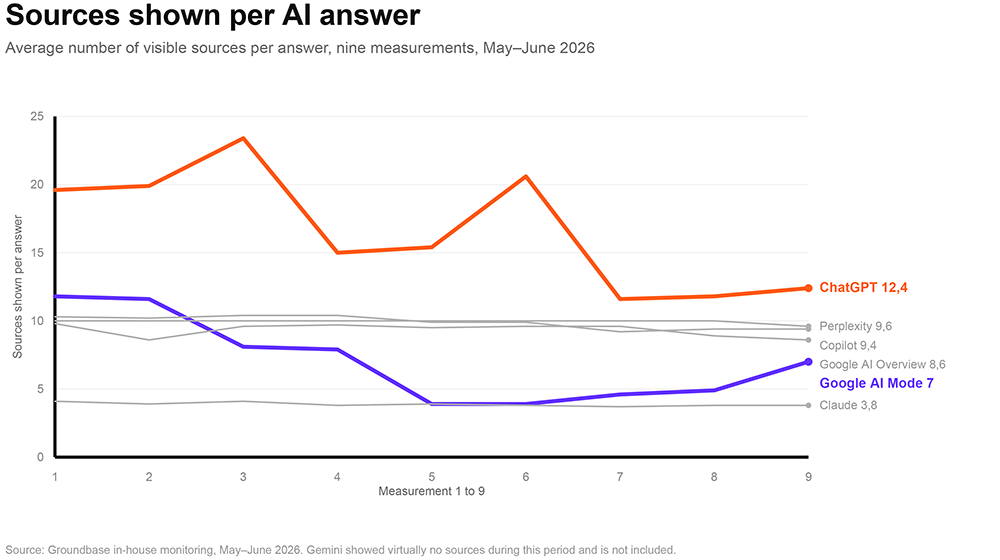
In our measurement, ChatGPT went from an average of twenty displayed sources per answer to twelve. Google AI Mode halved: from nearly twelve to fewer than four, with a partial recovery in late June. Anyone monitoring AI visibility saw this in their dashboard as a falling citation score—and falling numbers demand explanations. Lost authority? Weaker content? A competitor gaining ground?
Our data says: probably none of the three.
The basis for that conclusion: continuous monitoring of several hundred prompts across seven AI models. Nine measurement points between early May and late June 2026 form the series in this piece; together with interim control measurements, that amounts to over 27,000 answers in the period. And across that series, one pattern emerges: at the models that shortened their source lists, the number of displayed sources fell far more sharply than brand presence in the answers.
II. Two models changed. The rest didn't.
Look first at what actually moved.
Google AI Mode shortened its source list in two distinct steps—one in the second half of May, one in early June. ChatGPT followed its own rhythm, also in two steps, in late May and mid June. Two models, two different moments, two different calendars.
The rest of the field barely moved. Claude showed a stable handful of sources throughout the period. Copilot and Google AI Overview stayed flat around ten. Perplexity sat at almost exactly ten sources per answer, measurement after measurement—which strongly suggests a hard display limit rather than selection behaviour. Gemini showed virtually no sources during this period.
So this doesn’t look like a movement within the market we measured. The change is concentrated in two models, each on its own timing. That pattern is consistent with a change in display policy, at moments of the model’s own choosing. What the model builders changed internally, we don’t know—we observe behaviour, not release notes. But the timing and shape of the declines point to product decisions on the models’ side, not to anything brands did or failed to do.
III. The answer text barely moved
Now the interesting part. Because a shorter source list could be read as: the model uses fewer sources, so the chance that you’re among them shrinks proportionally. That’s not how it works—or not entirely.
When we lay the displayed sources next to the answer text itself, the two layers diverge. The chance that a brand from our measurement appears as a visible source fell sharply at ChatGPT and Google AI Mode, in step with the shorter lists. But its presence in the answer text moved far less—source visibility fell roughly three times as hard as text presence, and the latter was virtually flat until mid June.
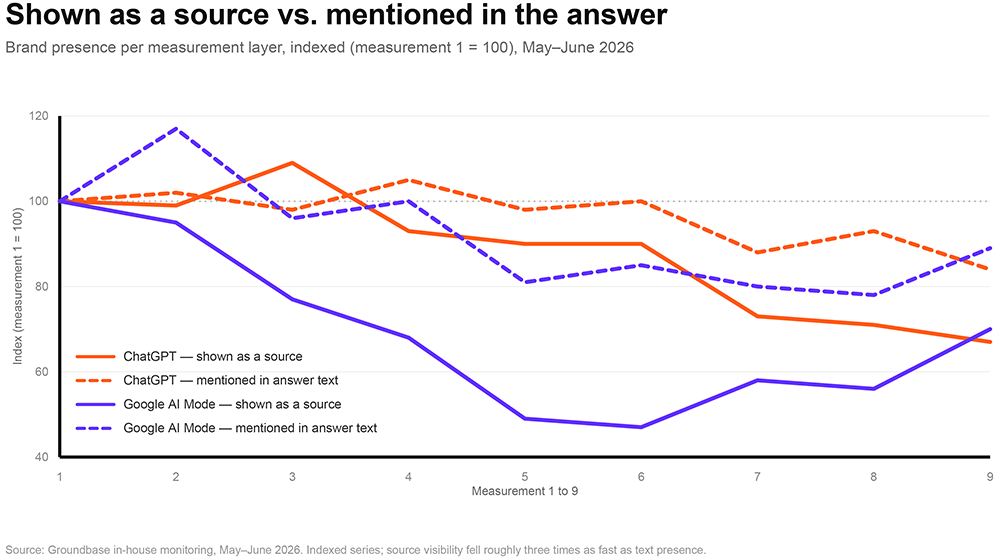
That difference is the core of this piece. Citations and mentions are two different measurement layers, even though they often end up in the same chart.
A citation is a display decision by the model: which sources do I make visible to the user? That’s display policy. A choice a model builder can change tomorrow, while the same brands largely remain in the answer.
A mention is a content decision: which brands belong in this answer? That sits closer to what you actually want to know—whether you’re in the game at the moment someone asks a question in your domain.
The first layer is volatile, because it depends on product decisions at OpenAI, Google and the others. The second layer proved far more stable in our measurement. Anyone who lumps both layers together—and most dashboards implicitly do—is measuring a mixture whose composition they don’t know.
An important nuance: the numbers themselves aren’t wrong. A falling citation score is a correct measurement of what the model displays. The problem only arises at interpretation—when a change in display behaviour is read as a change in position.
And for completeness: whether models also consult fewer sources—and how much of their answer comes from sources at all, rather than from what they already knew—we cannot see from the outside. We measure the shop window, not the warehouse. The fact that brand mentions held steady only tells us that measured brand presence barely changed—not how many sources the model consulted, and not whether the answer changed in other respects.
And this is one measurement, over two months, in one measurement setup. The pattern is sharp, but we’re not generalising it to all markets and all situations. What we do dare to say: the mechanism behind it—display and content that don’t necessarily move in proportion—isn’t tied to one brand or one sector.
There’s one weaker signal in the data. ChatGPT repeats the same domain within a single answer slightly less often than before. That fits the hypothesis that models are aiming for more distinct sources in a shorter list—but the difference is too small to build anything firm on. We note it as an observation, not a finding.
IV. The reading rule
The practical lesson fits in two sentences.
Never read citation trends in isolation from mention trends. Put the two lines side by side, per model, and watch what they do.
If they diverge—citations falling, mentions holding—you’re looking at the model’s display policy. Annoying for your click-through traffic, perhaps, but in itself no evidence that your substantive position deteriorated. No reason to overhaul your content strategy based on something a model builder may well reverse next month.
If they converge—both lines sinking together—that’s a much stronger signal that your position in the answer is weakening. Then you’re not losing your place in a source list, but possibly your place in the answer itself. That is the signal to act on.
May and June have shown how easily the two get conflated. Anyone who only watched their citation dashboard saw a crisis. Anyone who laid both layers side by side saw no collapsing brand visibility, but changing display behaviour.
If you only count citations, you’re measuring the display policy of someone else’s product. If you read both layers, you’re measuring your brand.